NIFTY 50 · Market Structure · Trade Review
Daily Structure Mapping
Understand the market one structure at a time. This page is designed for daily trade breakdowns: the higher-timeframe bias, key swing points, structural shifts, liquidity context, and the reasoning behind a trade idea—without treating any setup as a guaranteed outcome.
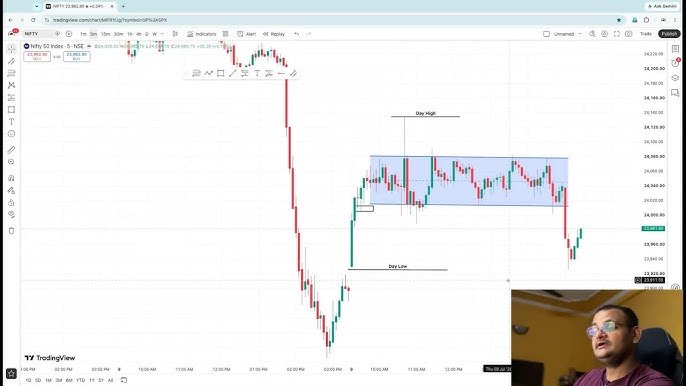
IMAGE FORMAT: 1280 × 720 PX · 16:9
Daily breakdown
Today’s Market Structure
Replace the prompts below with your actual chart observations for the day before publishing. Add the date, timeframe, chart screenshot, and the specific price levels from your analysis.
Directional Context
Bias: [Bullish / Bearish / Range-bound]
Reason: [Explain the higher-timeframe context and what would invalidate this view.]
Important Areas
Resistance / supply: [Add level or zone]
Support / demand: [Add level or zone]
Liquidity: [Mark relevant highs, lows, or equal levels.]
BOS, CHOCH & IDM
BOS: [Which swing was broken, and did price confirm continuation?]
CHOCH: [Was there a meaningful change in market character?]
IDM: [Mark the inducement area according to your method.]
HH, HL, LH & LL
HH / HL: [Describe the bullish swing sequence, if present.]
LH / LL: [Describe the bearish swing sequence, if present.]
Current state: [Explain which sequence is valid and what price must do next.]
Trade journal
Daily Trade Explanation
Use this structure to explain the trade logic clearly, whether the day produced a trade, a loss, a win, or no valid setup.
Setup & confirmation
Instrument / timeframe: [e.g., NIFTY 50 · 5-minute]
Entry trigger: [Describe the condition, not just the entry price.]
Invalidation: [What would prove the idea wrong?]
Risk & execution
Planned risk: [State the risk approach.]
Exit / management: [Explain how the trade was managed.]
Outcome: [Win / loss / breakeven / no trade.]
What price did
[Walk through the sequence from liquidity and swing points to BOS or CHOCH, entry confirmation, and exit.]
Lesson of the day
[What did the market teach you? Note any execution mistake, emotional reaction, or rule followed well.]
Education first: explain the evidence visible on the chart, include invalidation conditions, and avoid presenting a single trade as proof that a method always works.
Concept reference
Structure Terms at a Glance
BOS — Break of Structure
A break of a relevant swing level that may support continuation in the current direction, depending on context and confirmation.
CHOCH — Change of Character
A potential early signal that price behavior may be shifting. It should be assessed with the broader structure, not in isolation.
IDM — Inducement
An area identified as inducement within your SMC framework. Explain exactly which swing or liquidity feature you are marking on the chart.
HH / HL / LH / LL
Higher High, Higher Low, Lower High, and Lower Low. These labels help describe swing progression and the current structure.
Explore Profit Pathway
For background on this educational project, visit About Us. Read the trading disclaimer before using market examples, or contact Profit Pathway with questions.
Back to Home